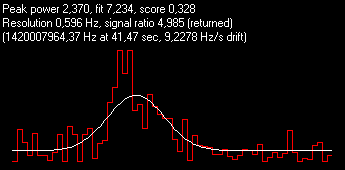
Gaussians are signals that
increase and then decrease in signal intensity as the
telescope moves across the sky.
(For those technically minded: A Gaussian is really a mathematical function, mostly commonly describing
the sort of distribution of values you get around the nominal
value of some property or measurement as a result of measurement
(and production errors).)
It is often described as a bell curve, as it starts off rising slowly, then accelerates before starting to level off and come
down in a mirror image of its rise, something like the cross section of a church bell.
It is comparable sound a car makes as it approaches you then
moves past.
If an ideal signal is sent from a distant planet, it will be seen on Earth as having a bell shape as Arecibo telescope's focus
moves across the sky. As the telescope approaches the source star, the signal will go up and then it will go down as the telescope moves away. Gaussians can also be produced by Earthly
interference, but generally an earthbound
signal would not get louder and then softer over the 12 second
period we are interested in.
The SETI@Home client shows you on screen the best Gaussian found so far based solely on the score it has, this
value is also stored in state.sah and used by many add-ons.
Gaussian score is calculated as power/fit. The best
predictor of a quality Gaussians is Signal Ratio (not
score)!

Here is a typical Gaussian graphs which show the familiar red "skyline" graph that represents the power at a
given frequency as seen over time. The white line shows the
Gaussian that best fits the "skyline". You can think of the peak power as the "height" of the bump, and the fit as
the "distance" between the red and white lines. (For the statistically minded, the
Gaussian fit value is actually the Chi-squared statistic.) The frequency, time, and drift
rates at which the signal(s) were detected are also shown.
Score alone is not good enough for determining if a
SETI@home thinks a Gaussian is interesting or to be
returned, since its power might be way too low.
The best Gaussian would have LOW fit, HIGH Signal ratio and
HIGH power!
The requirements for a Gaussian to be recorded
and reported back to SETI@home by their client are:
- Returned or Interesting - (Fit < 2 + 8 / 5 * Power) AND (Fit <
8.8)
Basically if you have a HIGH Signal Ratio (over 3.3 or
so) and your FIT is under 8.8 then it is a POSSIBLE signal,
and will be further analysed by supercomputers at Berkley.
|